
Key takeaways
- 01Start with business decisions, not software. Every dashboard should have an owner, a review rhythm, and a defined action.
- 02Combine sales, margin, inventory, customer, ecommerce, and fulfilment data to avoid improving one metric at the expense of another.
- 03Agree on shared definitions for products, locations, channels, customers, orders, returns, and promotions before connecting systems.
- 04Build descriptive and diagnostic reporting first. Predictive models are only useful after the underlying data is reliable.
- 05Roll out retail analytics in phases, beginning with a small set of decisions that have clear commercial value.
Retailers generate data every time a product is viewed, sold, returned, transferred, delivered, or purchased again. Yet many teams still make buying, promotion, and staffing decisions from separate spreadsheets because their point-of-sale system, ecommerce platform, ERP, loyalty programme, and delivery tools do not tell the same story.
Retail analytics turns that operational data into decisions. Done well, it helps a retailer understand not only what sold, but whether the sale was profitable, whether stock was in the right location, which customers returned, which promotion changed behaviour, and where money or time was lost.
This guide explains how Sri Lankan retailers can choose useful retail metrics, connect the right data sources, and build an analytics practice that leads to action rather than another dashboard nobody trusts.
Key Takeaways
- Start with business decisions, not software. Every dashboard should have an owner, a review rhythm, and a defined action.
- Combine sales, margin, inventory, customer, ecommerce, and fulfilment data to avoid improving one metric at the expense of another.
- Agree on shared definitions for products, locations, channels, customers, orders, returns, and promotions before connecting systems.
- Build descriptive and diagnostic reporting first. Predictive models are only useful after the underlying data is reliable.
- Roll out retail analytics in phases, beginning with a small set of decisions that have clear commercial value.
What Is Retail Analytics?
Retail analytics is the collection, preparation, analysis, and use of data from retail operations. It can cover physical stores, ecommerce websites, mobile apps, marketplaces, warehouses, loyalty programmes, marketing platforms, and delivery operations.
The goal is not to collect every possible number. It is to answer practical questions such as:
- Which products and categories generate contribution, not just revenue?
- Where are stockouts causing missed sales?
- Which locations hold slow-moving inventory?
- Are promotions increasing profitable demand or merely discounting purchases that would have happened anyway?
- Which customer groups return, buy across channels, or stop purchasing?
- Where do customers abandon the online journey?
- Are delivery delays or failed orders affecting repeat purchases?
A useful retail analytics system connects these questions to consistent data, a responsible owner, and an operational response.
Why Standard Retail Reports Often Fall Short
Most retail platforms provide reports. The problem is that each report sees only the activity inside its own system.
A POS may show store sales but not abandoned online checkouts. An ecommerce platform may show conversion but not the true cost of inventory or branch returns. A loyalty platform may identify repeat customers without knowing fulfilment failures. An ERP may hold cost and stock records but lack customer behaviour and campaign context.
When reports remain separate, several problems appear:
- Revenue differs between finance, POS, and ecommerce reports.
- The same product has different names or codes across systems.
- Online returns are not connected to the original channel or campaign.
- Customer records are duplicated by phone number, email address, or loyalty ID.
- Promotions cannot be assessed after stock, returns, discounts, and delivery costs are considered.
- Teams spend reporting time reconciling totals instead of investigating performance.
The first job of retail data analytics is therefore alignment. A retailer needs agreed definitions and traceable data before it needs advanced visualisations.
The Four Levels of Retail Analytics
Retail analytics usually develops through four levels. Each level depends on the quality of the one before it.
Descriptive Analytics: What Happened?
Descriptive reporting summarises actual performance. Examples include daily sales, gross margin, inventory on hand, online conversion rate, average transaction value, return rate, and delivery completion rate.
This layer should make it easy to compare periods, stores, channels, categories, brands, and customer groups without rebuilding the report each time.
Diagnostic Analytics: Why Did It Happen?
Diagnostic analysis investigates the drivers behind a result. If revenue fell, was the cause lower traffic, weaker conversion, unavailable stock, a category decline, fewer returning customers, or a change in discounting?
A good diagnostic dashboard lets teams move from the headline to the contributing products, locations, customers, campaigns, or process exceptions.
Predictive Analytics: What Is Likely to Happen?
Predictive analytics uses historical patterns and relevant variables to estimate future demand, churn risk, replenishment requirements, or promotion response.
Forecasting can be valuable, but only when identifiers, event dates, stock movements, returns, and historical definitions are dependable. Automating a forecast on inconsistent data produces confident-looking noise.
Prescriptive Analytics: What Should We Do?
Prescriptive analytics recommends or triggers an action, such as transferring stock, changing a reorder quantity, targeting a customer segment, or escalating a fulfilment exception.
These recommendations need business rules, approval controls, and a way to measure the result. Human oversight remains important when decisions affect pricing, customer treatment, or significant inventory commitments.
The Retail Data Sources You Need to Connect
A complete retail view rarely comes from one system. The following sources typically contribute different parts of the answer.
POS and Store Operations
POS data provides transactions, line items, discounts, cashiers, locations, payment methods, returns, and sometimes customer identities. It is essential for understanding physical-store demand and comparing branches.
Ecommerce Platform
Shopify, WooCommerce, or a custom storefront can provide product views, searches, carts, checkouts, orders, discounts, customer activity, and channel attribution. Ecommerce data should be connected to fulfilment and financial outcomes rather than assessed only through web sessions.
ERP, Inventory, and Procurement
These systems usually hold product costs, suppliers, purchase orders, stock movements, warehouses, and accounting records. They provide the cost and availability context required to judge sales quality.
Loyalty and Customer Data
A loyalty programme or CRM can connect transactions to a persistent customer profile. This enables cohort analysis, repeat-purchase reporting, customer value analysis, and more relevant offers.
Customer data should be collected and used with appropriate consent, access controls, and retention rules. Analytics does not justify gathering information the business does not need.
Delivery and Fulfilment
Dispatch, tracking, fulfilment, and proof-of-delivery data reveal whether a completed checkout became a successful customer outcome. Failed delivery, late delivery, cancellation, and return-to-origin events should be linked to the original order.
Marketing and Website Analytics
Campaign cost, traffic source, landing-page behaviour, and ecommerce events help explain how demand was generated. Marketing reporting becomes more useful when it is joined to margin, returns, fulfilment, and repeat purchase rather than stopping at clicks or orders.
12 Retail KPIs Worth Tracking
The right KPI set depends on the decision and the operating model. These measures give many retailers a practical starting point.
1. Net Sales
Net sales should account for discounts, cancellations, and returns according to one agreed definition. Keep gross sales available for context, but do not treat it as realised performance.
2. Gross Margin Percentage
Gross margin percentage is commonly calculated as:
(Net sales - cost of goods sold) / Net sales x 100
Compare margin by product, category, store, channel, and promotion. Revenue growth with declining margin may signal excessive discounting or a costly product mix.
3. Average Transaction Value
Net sales / number of completed transactions
Average transaction value can reveal changes in basket size, pricing, and product mix. Review it alongside conversion and margin so a higher average is not mistaken for success if fewer customers purchase.
4. Units per Transaction
Units sold / number of completed transactions
This metric helps evaluate bundling, cross-selling, merchandising, and promotion mechanics. Segment it by channel and store format because customer missions differ.
5. Conversion Rate
For ecommerce, conversion rate usually compares completed purchases with eligible visits or sessions. For stores, the denominator may be measured footfall.
Document the denominator and exclusions. A conversion rate is not comparable when one team counts sessions, another counts users, and a third excludes unavailable products without saying so.
6. Sell-Through Rate
Units sold during a period / units available for sale during that period x 100
Sell-through helps buying and merchandising teams understand whether inventory is moving at the expected pace. Review it by product age, season, location, and markdown status.
7. Inventory Turnover
Cost of goods sold / average inventory value
Inventory turnover helps indicate how efficiently stock supports sales. Interpret it with stockout and service levels: very high turnover can be a warning if customers frequently cannot find products.
8. Stockout Rate
A stockout rate can measure the proportion of product-location checks or demand events where an item was unavailable. The exact formula must match the retailer's data and operating questions.
Track lost availability by SKU and location, then distinguish supplier delays, forecasting errors, inaccurate records, and replenishment failures.
9. Gross Margin Return on Inventory Investment
Gross margin / average inventory cost
Often shortened to GMROI, this measure connects inventory investment to the gross margin it produces. It can support assortment and allocation decisions better than revenue alone.
10. Return and Refund Rate
Measure returned units or refunded value against eligible sales, then add reason codes. Size, quality, description accuracy, fulfilment errors, and customer preference require different responses.
11. Repeat Purchase Rate
Customers who made more than one purchase in the period / customers who purchased in the period x 100
Use a timeframe suited to the category's normal purchase cycle. Link store and online identities carefully so cross-channel customers are not counted as separate people.
12. Fulfilment Success Rate
Measure orders completed correctly and within the promised service window. Pair this with cancellation rate, failed delivery rate, dispatch time, and return-to-origin rate where relevant.
A retailer may record strong online conversion while losing margin and loyalty after checkout. Fulfilment analytics closes that blind spot.
Build a Retail KPI Dashboard That Leads to Action
A useful dashboard is designed around decisions and operating rhythms.
For every KPI, define:
- The business question it answers
- The calculation and exclusions
- The source systems
- The level of detail required
- The update frequency
- The acceptable range or target
- The person responsible for reviewing it
- The action triggered by a material change
Executives may need a weekly view of sales, margin, stock exposure, customer retention, and fulfilment. Store managers may need daily exceptions. Buyers may need SKU-location sell-through and weeks of cover. Ecommerce teams may need product availability, conversion, payment failure, and checkout analysis.
Do not force every user into one overloaded dashboard. Use the same governed data and definitions, then provide views suited to each decision.
How to Create a Reliable Retail Analytics Architecture
The architecture should fit the retailer's scale, systems, decision speed, and support capacity.
Option 1: Native Platform Reporting
A retailer operating mainly within one commerce platform may begin with its built-in reports. This is the fastest approach when online and store operations already share products, customers, inventory, and orders.
It becomes less complete when cost, procurement, loyalty, accounting, or delivery data lives elsewhere.
Option 2: Connected Operational Reports
APIs, webhooks, scheduled exports, or middleware can move selected data between systems and create reconciled operational views.
This can work well when the immediate goal is a small number of cross-system decisions, such as inventory availability, order exceptions, or loyalty performance.
Option 3: Central Analytics Data Platform
A data warehouse or similar central layer can preserve detailed history from POS, ecommerce, ERP, loyalty, marketing, and delivery systems. A business intelligence tool then serves governed dashboards and analysis.
This approach supports more complex reporting and forecasting, but it adds engineering, data-quality, security, and maintenance responsibilities. It should be justified by actual decision needs, not by the appeal of a large technology project.
A 90-Day Retail Analytics Roadmap
Days 1-30: Define Decisions and Data
Choose three to five important decisions. Examples include reducing stockouts, improving promotion profitability, increasing repeat purchases, or lowering failed deliveries.
For each decision:
- Name the business owner.
- Define the baseline and desired outcome.
- Agree on the KPI formula.
- Identify the required systems and fields.
- Assess data quality, access, and historical coverage.
- Document customer-data and security requirements.
Days 31-60: Build and Reconcile
Create the minimum data flows and dashboards needed for the selected decisions. Reconcile sales, orders, returns, and inventory against existing operational and finance totals.
Investigate discrepancies instead of hiding them with manual adjustments. Record the definition and source of every metric so users can challenge and improve it.
Days 61-90: Pilot Actions and Measure Results
Test the dashboard with a limited team, category, or location. Create a review routine and record the actions taken.
For example, a weekly stock meeting may use sell-through, stockout, and inventory-age data to approve transfers or replenishment changes. A customer team may test one retention action for a clearly defined segment.
Compare results with the baseline. Keep the reporting that changes decisions, improve the data that causes doubt, and remove measures that nobody uses.
Common Retail Analytics Mistakes
Measuring Revenue Without Margin
Sales growth can hide discount leakage, expensive fulfilment, high returns, or an unprofitable product mix. Pair commercial metrics with cost and margin.
Treating Customer Records as Automatically Unified
The same person may use different emails or phone numbers across channels. Identity rules should be conservative, auditable, and privacy-aware.
Ignoring Returns and Cancellations
A dashboard built from order creation alone can overstate revenue, promotion success, conversion quality, and customer value.
Automating Before Agreeing on Definitions
Automation makes calculations faster; it does not resolve disagreement about what a sale, active customer, stockout, or successful delivery means.
Building Dashboards Without Owners
A metric without an owner or response becomes decoration. Connect exceptions to named teams and operating processes.
Starting With Predictive AI
Forecasting and recommendations depend on clean historical events. Begin with reliable descriptive and diagnostic reporting, then add prediction where it improves a defined decision.
Questions to Ask a Retail Analytics Partner
Before selecting a platform or implementation partner, ask:
- Which business decisions will the first release improve?
- How will POS, ecommerce, ERP, inventory, loyalty, and delivery records be matched?
- Which system is the source of truth for each data domain?
- How will historical changes to products, stores, customers, and promotions be handled?
- How will report totals be reconciled with finance and operational systems?
- What happens when an API, file transfer, or webhook fails?
- Who can access customer-level data, and how is access audited?
- Can users trace a KPI back to the underlying transactions?
- Who maintains connectors and metric definitions after launch?
- How will the project prove value within the first 90 days?
Clear answers reduce the risk of buying an impressive dashboard on top of unreliable data.
Turn Retail Data Into Better Decisions
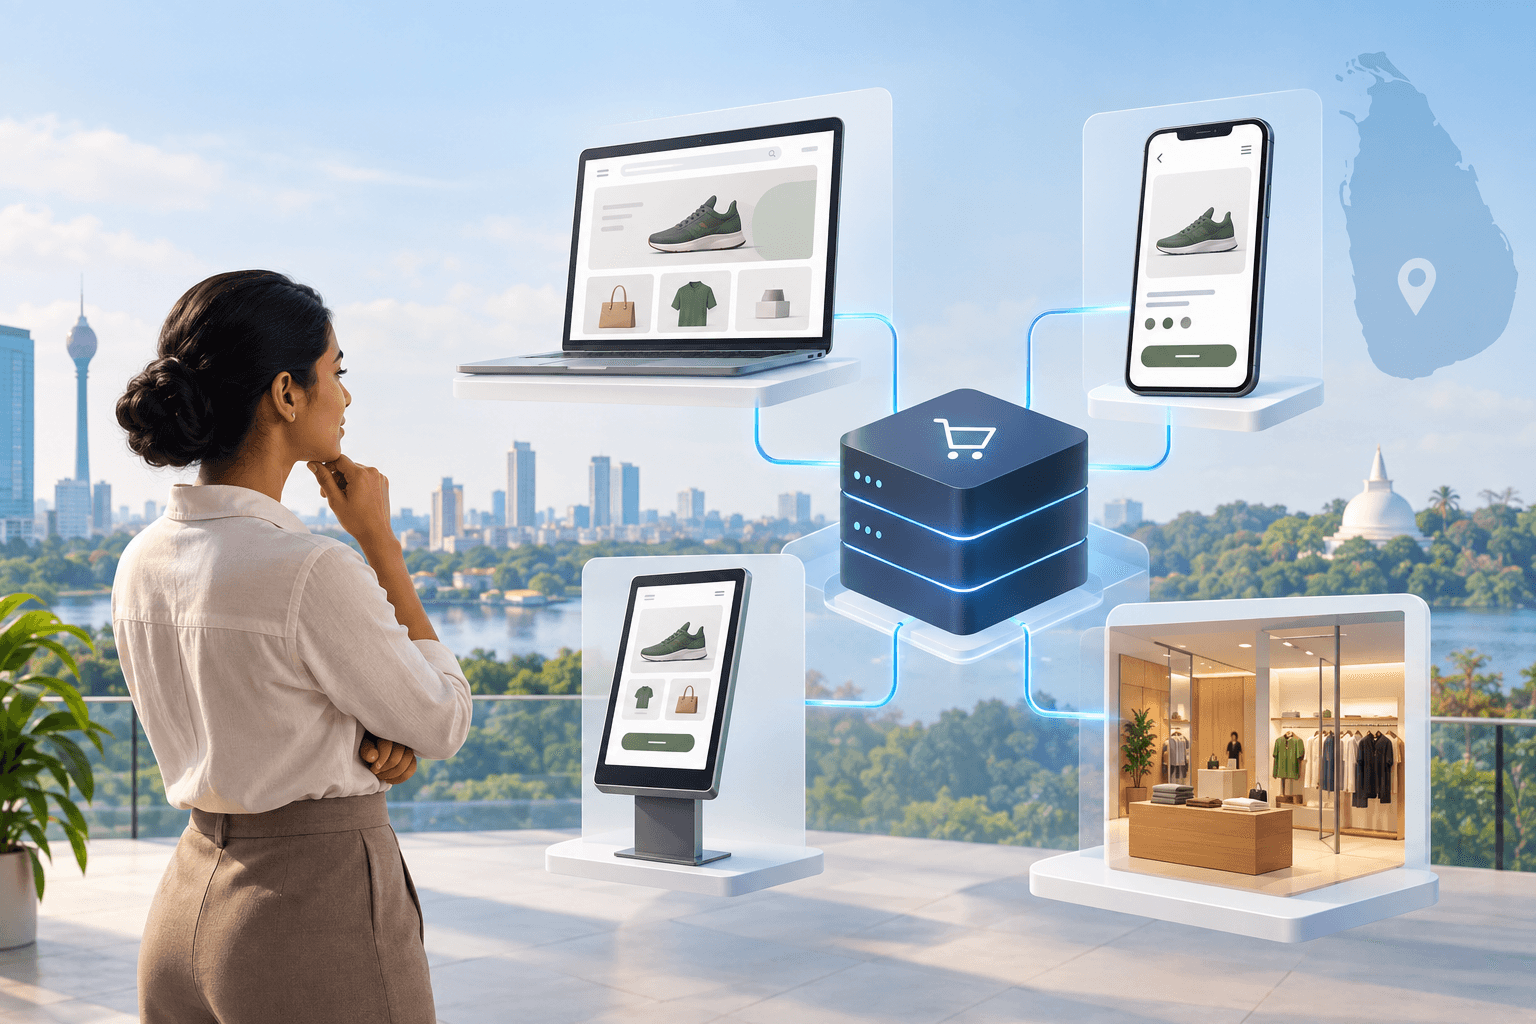
Retail analytics creates value when it connects the whole operating journey: discovery, purchase, inventory, customer, fulfilment, and repeat business. For Sri Lankan retailers running stores and ecommerce together, that often means aligning Shopify or WooCommerce with POS, ERP, loyalty, and delivery systems before advanced reporting can be trusted.
Konekt's retail digital transformation services bring ecommerce, POS and ERP integration, loyalty, delivery, inventory synchronisation, and retail analytics into one implementation view. Our POS integration guide explains how to connect operational systems, while our ecommerce planning guide helps teams define the wider commerce model.
If your reporting still depends on disconnected exports and manual reconciliation, talk to a Konekt retail specialist. We can help assess the current data flows, identify the highest-value analytics use cases, and shape a practical rollout around the systems your business already uses.
- retail analytics
- retail data analytics
- retail KPI dashboard
- omnichannel analytics
- POS analytics
- ecommerce analytics
- retail business intelligence
- Sri Lanka
- retail